The player chart on game pages has been rebuilt. It used to draw the whole recording as one line.
Four periods and the exact number
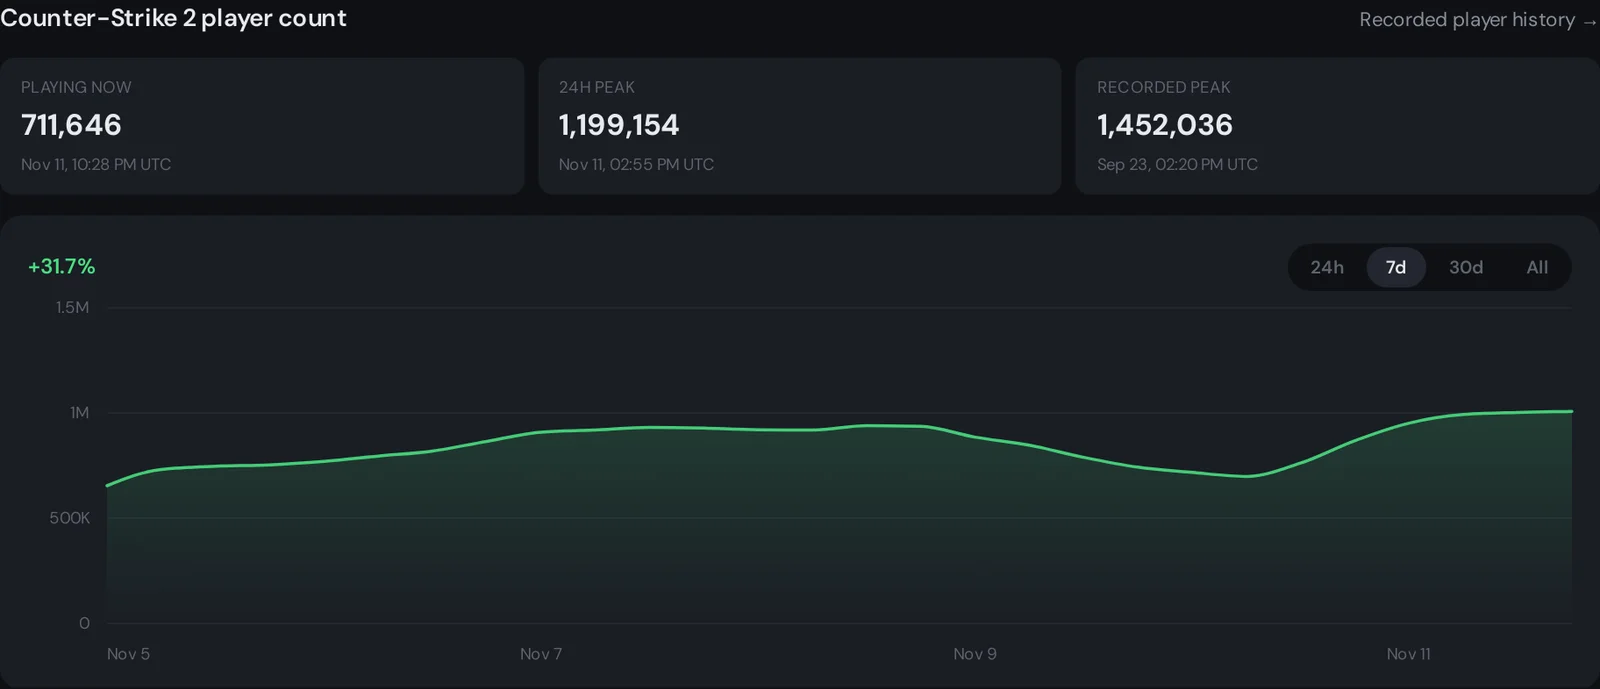
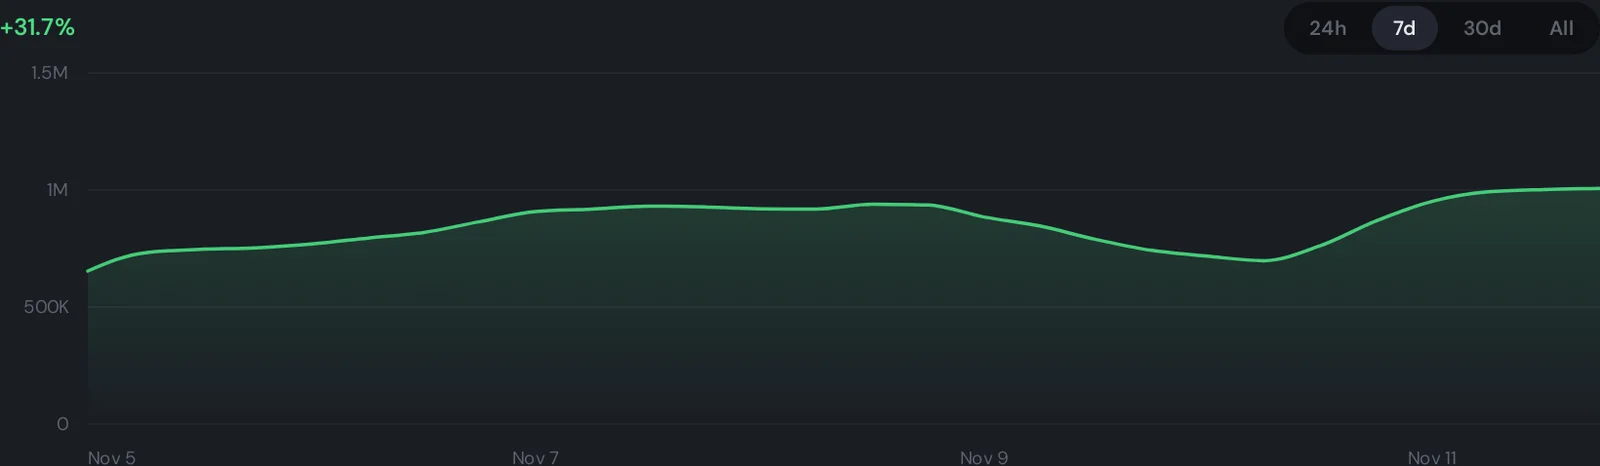
The chart switches between 24 hours, 7 days, 30 days and everything we have recorded for the game. Point at the line, or tap it on a phone, to see the number of players and the time of the sample. The arrow keys move along the line.
Below is the live chart of Counter-Strike 2.
What else changed
- Shorter addresses. A game page is now
/tools/steam-charts/counter-strike-2. The old address with the number in front still works and leads to the new one. - The same chart in spaces. The overview of Counter-Strike 2 and Deadlock shows the last week of players on the same chart.
What the chart is drawn from
- Periods
- 24 h, 7 d, 30 d, all
- Recorded every
- 10 minutes
- Every sample kept
- 35 days
- Older days
- 1 point a day
Steam publishes the 100 most played games with the number of players in each. We record that list every ten minutes. The last 35 days are kept sample by sample. Older days are kept as one point a day, the average of that day, with the highest and the lowest sample saved separately, so the recorded peak of a game stays exact.
The list of games with their charts is on the Games page.